ROCIS Data Explorer
When you first start using a Dylos particle monitor in your home, you might notice dramatic spikes in readings from cooking, flopping down on the couch, or opening the windows when outdoor pollution is high. These incidents are important to pay attention to, of course, but the Dylos data will give you a lot more information about your indoor air quality than just reporting “big bad” spikes in particles. In one week alone, the three Dylos particle monitors generate 60,000 data points for each site!
To help you interpret all of the data gathered by your monitor, ROCIS has developed the Data Explorer tool.
About the ROCIS Data Explorer
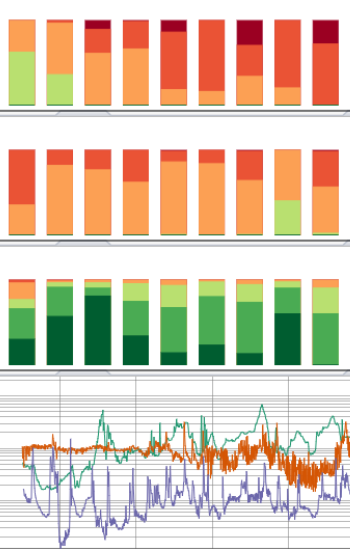
The ROCIS Data Explorer is a visualization tool that displays 15-minute averaged particle monitoring data for a given monitoring site with two different styles of graphical representation:
- The first graph, a stacked bar chart, shows each of the three monitors at a single location. The data is displayed as a percentage of time that the air was within given ranges: very poor, poor, fair, good, very good, excellent.
- The second visualization is a time series line graph showing the scale of particle count over time. This graph color-codes the line of data to correspond to each machine at a monitoring site. There are various toggles for total displayed time, machines displayed, smoothing of data lines, and the scale of particle count. This tool even lets you create hypothetical scenarios—adjusting outdoor contaminants and timeframes—to better understand how the outdoor air is impacting indoor air quality.

Sample ROCIS Explorer Data from LCMP
ROCIS team member Don Fugler walks through several examples from the homes of participants in our Low Cost Monitoring Project (LCMP).
LCMP Participant Example 4
Plug in the code m6i6 to the ROCIS Data Explorer to further examine data from this participant’s home.
LCMP Participant Example 6
Plug in the code j1t8 to the ROCIS Data Explorer to further examine data from this participant’s home.
LCMP Participant Example 7
Plug in the code w2i9 to the ROCIS Data Explorer to further examine data from this participant’s home.
LCMP Participant Christmas Example
Plug in the code e3j9 to the ROCIS Data Explorer to further examine data from this participant’s home.
