ROCIS Data Explorer - Participant Example Christmas
This link will take you to the Data Explorer site: https://bluetree.shinyapps.io/lcmpexplorer2/
In the case below, we are discussing Example 4, which can also be accessed by entering the participant code e3j9.
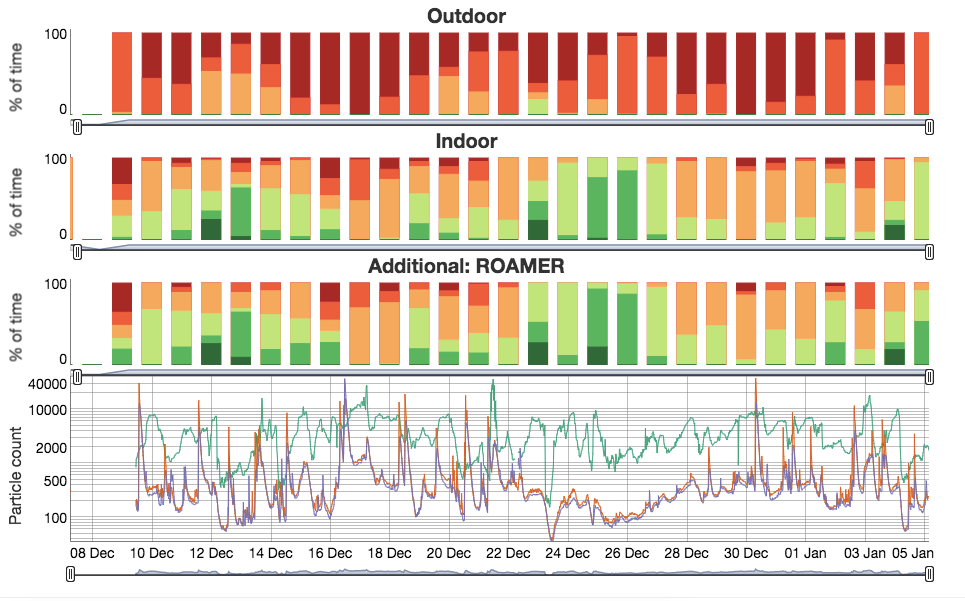
This example is a Christmas story. This monitored participant appears to have left the house for a Christmas visit. An empty house has a different particle generation signature. Here is the full set of participant data. Outside particle levels are generally in the Dylos “Poor” to “Very Poor” range. The inside monitors are showing “Fair” to “Good”.

Now we will highlight the week around Christmas Day. Look for a change in indoor particle behavior beginning December 22.

Before December 22, you can see daily spikes in the Dylos small graph (the Dylos large graph would be even more illustrative). They appear to happen around meal times. Let’s highlight a couple of days to see whether these spikes could be connected to food preparation.

This is not definitive, but the large (>1000 count) peaks in indoor particles on these two days occur just after noon on December 20 and around 7:00 am on December 21. These, then, could be meal preparation particle peaks. On the other hand, look at the indoor particle counts from December 24 to 28, during the period which appears to be time away.

The indoor particle counts are mostly <300 and they follow the outside pattern closely. There is no indication of any indoor activity that creates particles.
Disclaimer: This is all speculative, as we never did receive a good record of this participant’s activities for the period. They might write back and tell us that they were just sleeping for four days and hence causing no particle disturbances. However, until that letter arrives, this is our best guess at an explanation.
Return to the ROCIS Data Explorer page.
