Because most modern air pollution (at least in southwestern Pennsylvania) is so small that it’s more or less invisible, it can be easy to ignore. That’s part of why we run the Low Cost Monitoring Project. Not only do we loan low cost air monitors to our LCMP participants, we also provide them with the tools to “see” their air quality data. Tracking indoor and outdoor particle levels, LCMP participants learn how closely the two are related. As we introduce different kinds of air quality interventions—loaning items such as filters, induction stovetops, and more as part of the LCMP program—the monitoring data shows each homeowner or renter what makes a difference to their air quality.
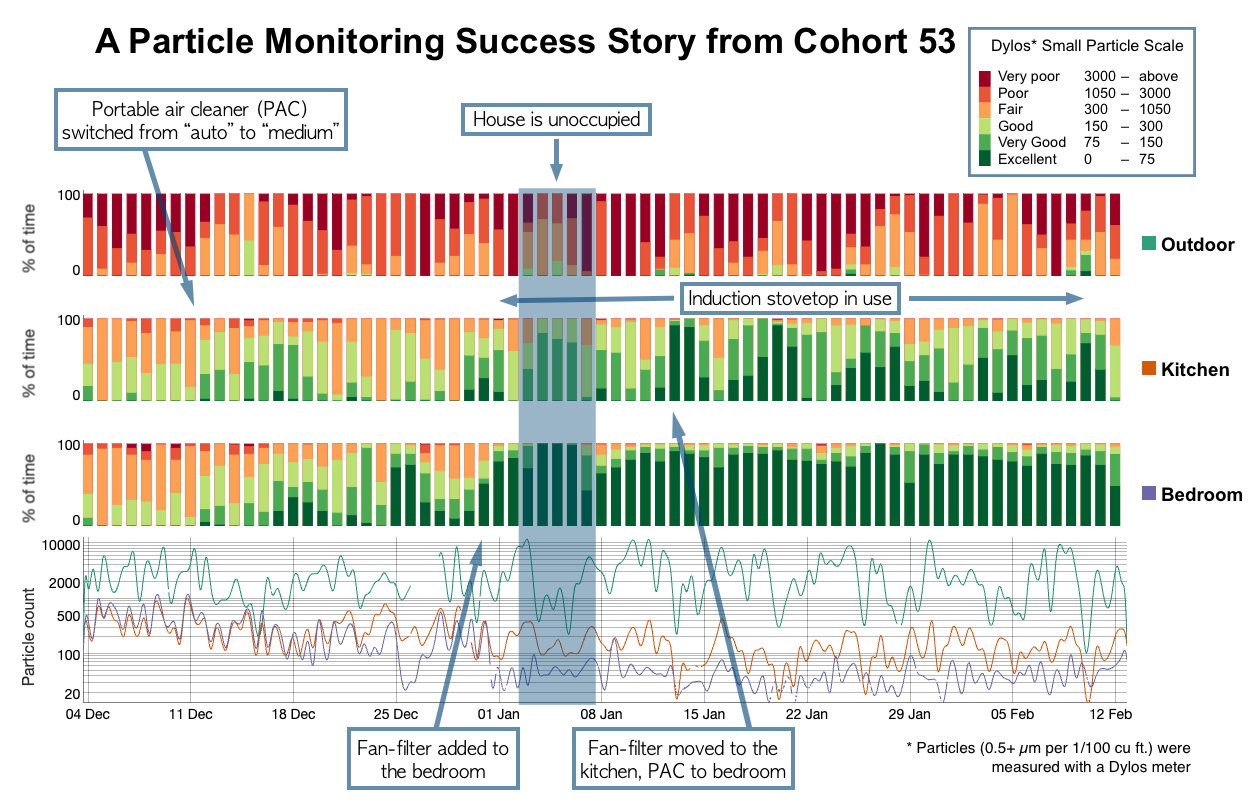
Katy, a participant in LCMP Cohort 53, agreed to let us share her data with you to demonstrate just how effective some of these interventions can be in mitigating air pollution indoors. The chart below was produced using our ROCIS Data Explorer. We have added labels to indicate the changes that Katy made in her home.

Notice, in the line graph at the bottom, that the indoor and outdoor particle levels are much closer at the beginning of the monitoring period than at the end. For the first week or so, Katy was running a portable air cleaner (PAC) on “auto” mode in the kitchen. Most of the time, her PAC was on “low,” but when particles in the kitchen spiked from cooking, the fan would rev up to “high,” which Katy notes was a bit loud. We recommend using PACs at a constant level—this tends to keep overall particle levels lower than reactive “auto” modes, which only kick on during major spikes and do little to reduce particles during much of the time. As you can see in the data, when Katy switched the PAC to a constant level of “medium,” the overall particle count in the kitchen dropped noticeably. In addition, the annoying revving stopped, and Katy reports that the fan noise at “medium” was not much more than it was on “low.”
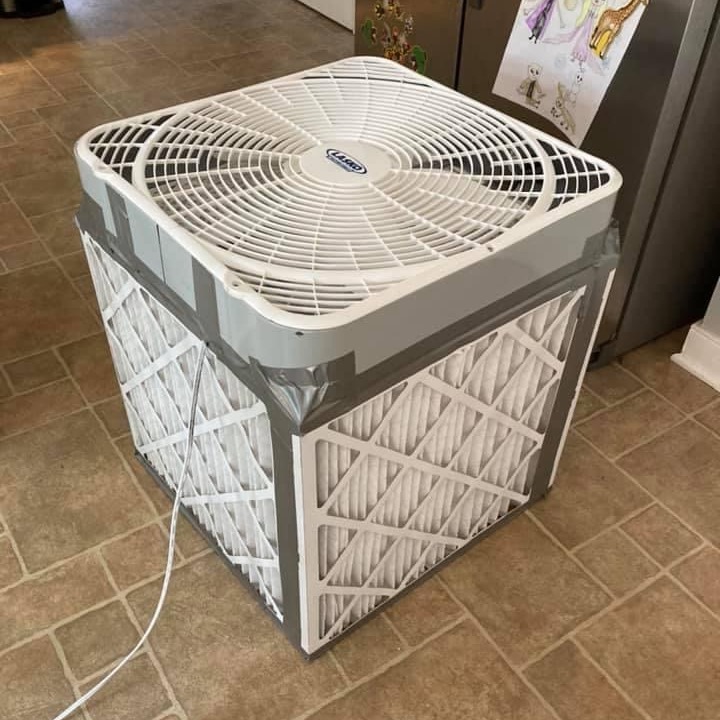
Another intervention that we cover in the LCMP is the DIY fan/filter—essentially, a high-performance filter attached to a box fan. Katy put a fan/filter in the bedroom, and the particle counts dropped remarkably, as the bottom bar graph demonstrates. In fact, when the family wasn’t there to stir up dust and other particles, the bedroom air had several days of 100% excellent air. But even after they returned, the air in the bedroom remained very good or excellent nearly all the time.

Learn more about both PACs and fan/filters on our Portable Air Cleaners page
Seeing this dramatic improvement, Katy decided to switch the location of the fan/filter and the PAC. With the fan/filter running in the kitchen, the particle counts improved sharply, as you can see on the chart. Katy notes that they also started using an induction stovetop around this time, which may have helped to reduce kitchen particle counts. That said, Katy tells us that keeping cooking pots covered had the greatest impact on kitchen pollution.
Want to learn more about reducing exposure to air pollution in the kitchen? Check out our resources on Kitchen Range Hoods and behavioral interventions.
Are you interested in participating in our Low Cost Monitoring Project? Participation is free, and the whole family is welcome to join. Find out more about the project and any upcoming monitoring cohorts here. Our cohorts are generally made up of folks from southwestern Pennsylvania, but we can accept a few participants in each cohort from outside of the region.
Contact us with questions.
