What we found by measuring CO2
Don Fugler
Carbon dioxide (CO2) is everywhere. It’s in the breath you exhale, the emissions from your gas stove, and the smoke from your fireplace. Plants use it during photosynthesis to produce oxygen and sugars. Everyone knows CO2 as the “greenhouse gas” that leads to catastrophic climate change, but today we are going to dig into the implications of carbon dioxide inside your house.

Why talk about CO2 and housing? Because carbon dioxide may help determine if your house is adequately ventilated. If there isn’t enough air exchange with the outdoors, the CO2 produced by the people inside starts to build up. Using occupant-generated CO2 as a tracer gas to estimate air change rates with the outdoors is not an exact science. That said, using a CO2 monitor in your house can tell you a great deal about the balance of occupancy (how many people are in the house), activity (are they bouncing on the couch or fast asleep), air movement within the house (are you in a small room with the door closed), and house ventilation rates.
For more on the ins and outs of indoor CO2 monitoring, listen to this interview with air quality researcher Andrew K. Persily.
Here’s how it works: People produce CO2 emissions just by breathing. The tighter the house, the less outdoor air that enters to dilute the CO2 and other indoor pollutants. Although very high CO2 can cause drowsiness, headaches, brain fog, and other health problems, these levels are rarely found in houses.
Typical atmospheric CO2 had been around 350 parts per million (ppm)—at least when scientists started measuring it—but in recent years it has been inching up into the 400–450 ppm range. Indoors, that number is usually higher. For a long time, 1000 ppm has been the industry standard for the threshold of acceptable indoor CO2 levels.
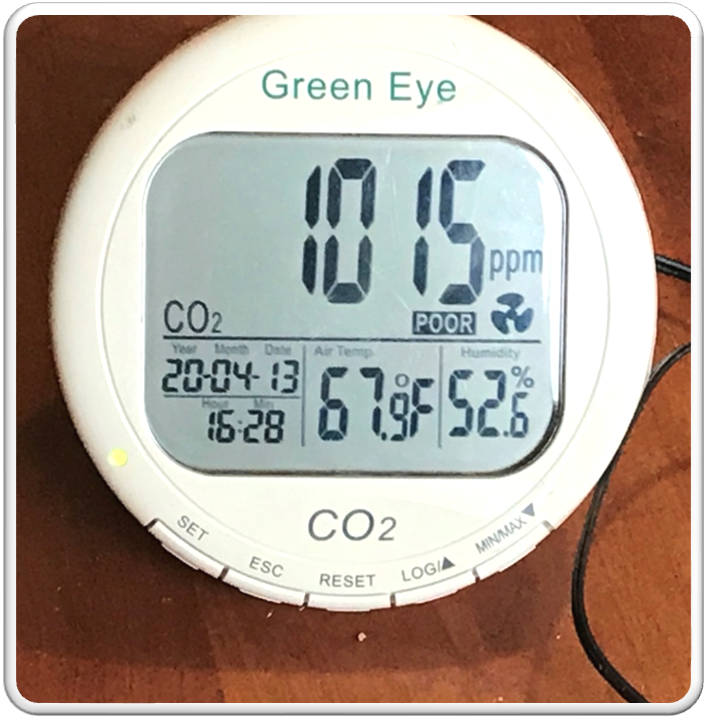
As part of our Low Cost Monitoring Project (LCMP), ROCIS has tested over 400 buildings (mostly houses) for a variety of pollutants, including carbon dioxide. During the 3- to 4-week program, LCMP participants receive one CO2 monitor, which they are asked to place in the master bedroom. We do this for two reasons: a) research has found that bedroom CO2 can peak overnight, especially if the door is closed; and b) it makes sense to check the air in the room where people spend 8 or so hours a day. We’ve seen some interesting results from all that monitoring!
Learn more about the monitors we use, the data we collect, and the tools we use to make sense of it on our ROCIS Data pages.
A few things to note about our findings: The ROCIS sample may not perfectly represent Pittsburgh or state demographics. First, most of the buildings in our sample were single-family homes, not attached dwellings. Second, because ROCIS houses rarely contain smokers, the CO2 summary below does not reflect the additional carbon dioxide that would be produced by tobacco or pot smoking. Third, most of the households in our sample have not included families with children, which impacts occupancy factors. And finally, keep in mind that Pittsburgh housing stock is quite old. By comparison, newer houses are more likely to be airtight as well as to contain some type of dedicated ventilation system.
So, what did we find when looking at CO2 in the several hundred Pittsburgh houses?

Here is a brief summary of the results.
- Low CO2 houses, 400–800 ppm: for some of our participants, CO2 concentrations are consistently low (below 800 ppm). This usually implies adequate ventilation. Sometimes we have encountered houses with levels as low as 400–450 ppm! Whether these houses are just very leaky or have their windows open much of the time, the people inside are effectively breathing outside air. That’s not necessarily a good thing. With a tighter building envelope, CO2 levels might rise somewhat, but the occupants could save energy on heating and cooling and be able to control the entry of outdoor air.
- Low CO2 with >1000 ppm spikes: for many low-concentration houses, there may be the odd excursion above 1000 ppm. During a month of monitoring, it’s not uncommon to see a few readings in the 1000–1500 ppm range. Maybe the furnace didn’t run all night (which would otherwise mix the air). Maybe there were overnight guests. Maybe someone was cooking on a gas stove for a long period. Whatever the reason, we tell our participants not to worry about sporadic blips over 1000 ppm if their CO2 levels are consistently much lower.
Nearly all of the ROCIS houses fall into these first two categories. But a few situations give us cause for concern.
- Sustained periods of >1500 ppm: here is where we caution household occupants that they should make some changes. Often, we see CO2 creeping over 1000 ppm in late evening and then rising through the night to 2000+ ppm (remember, the monitor is in the master bedroom). If the CO2 is generally low during the day, this kind of pattern indicates that the master bedroom requires more ventilation overnight. Solutions could be as easy as keeping the bedroom door open, cycling or continuously running the furnace fan, opening a window, running the master bathroom fan, etc. How people reduce bedroom CO2 depends on the characteristics of their house, their need for privacy or security, the time of year, and other factors.
- Sustained high CO2 houses, >2000 ppm: ROCIS has found a handful of houses where CO2 stays in the 2000–6000 ppm range, even in the daytime. There are several possible explanations for such high levels, including spilling combustion appliances, very high house occupancy in a tiny dwelling, or an exceptionally tight house with almost no air leakage to the outside. In these cases, we first recommend getting a furnace/water heater/gas stove checkup, then we suggest looking into mechanical ventilation.
While ROCIS has found CO2 monitors to be a useful tool in understanding household ventilation, the results have to be interpreted in context. If two people live in a 3000+ square foot house, for instance, it’s unlikely that they will generate enough CO2 to noticeably raise levels. On the other hand, we have also monitored the air of a couple who share a tiny bedroom with their three dogs—it is no wonder that their overnight CO2 concentrations were high.
Generally, ROCIS has used the CO2 data to help advise individual participants on ventilation options. So far, we haven’t undertaken an extensive statistical analysis of our CO2 results. With a big enough sample size, we might be able to correlate CO2 averages and peaks with factors such as gas stoves, closed bedroom doors, single-family vs. apartment living, etc., which might prove very interesting. If you are experienced with big data sets and want to volunteer your services, please contact us.
We hope you have found this discussion of indoor CO2 to be helpful. There’s a lot to learn about our indoor environments where we spend so much of our time. To learn more about the Low Cost Monitoring Project and other indoor air quality solutions, check out those resources on our website:

